OpenTelemetry observability: a step-by-step guide
This post picks up where my earlier Copilot monitoring with OpenTelemetry article stopped and turns the focus to the basics.
We will start with a tiny Flask app from my OpenTelemetry playground, wire it to an OpenTelemetry Collector and the Aspire dashboard, then move to the Otel Bank demo to follow traces across frontend, API, Redis, and worker services.
Why start with a small app first?
If you jump directly into a multi-service demo, it is easy to confuse telemetry collection with business logic. A one-endpoint Flask service makes the basics obvious:
- the app emits logs,
- instrumentation turns requests into traces and metrics,
- the collector receives telemetry and forwards it,
- the dashboard makes the results visible.
Once this first mental model is clear, the distributed bank demo becomes much easier to read.

Step 1: Run the basic Flask app without telemetry
The v1.0.0 playground starts with a tiny rolldice endpoint. Before adding OpenTelemetry, the app is intentionally simple:
# Source: https://github.com/mikamboo/opentelemetry-playground/blob/v1.0.0/app.py
from flask import Flask, request
import logging
from pythonjsonlogger.json import JsonFormatter

app = Flask(__name__)
handler = logging.StreamHandler()
handler.setFormatter(JsonFormatter())
logging.basicConfig(level=logging.WARN, handlers=[handler])
Start it locally:
uv sync
uv run flask --app app run --port 8082
curl http://localhost:8082/rolldice
At this stage, the service works, but nothing is exported yet. That is an important baseline: OpenTelemetry does not replace your app, it layers observability on top of it.
Step 2: Start the backend that will receive telemetry
For a quick local lab, the playground uses two components:
- the Aspire dashboard for visualization,
- the OpenTelemetry Collector as the ingestion and routing layer.
Run the dashboard first:
docker run --rm -d \
  -p 18888:18888 \
  -p 18889:18889 \
  --name aspire-dashboard \
  mcr.microsoft.com/dotnet/aspire-dashboard:latest
Then start the collector:
docker run --rm \
  -p 4317:4317 \
  -v $(pwd)/otel-collector-config.yaml:/etc/otelcol-contrib/config.yaml \
  otel/opentelemetry-collector-contrib:latest
The collector configuration is intentionally short:
# Source: https://github.com/mikamboo/opentelemetry-playground/blob/v1.0.0/otel-collector-config.yaml
receivers:
  otlp:
    protocols:
      grpc:
        endpoint: 0.0.0.0:4317

exporters:
  otlp_grpc:
    endpoint: "aspire:18889"
    tls:
      insecure: true
This is a great first lesson: the collector decouples your application from the final backend. Today it forwards to Aspire, but the same pattern works with Grafana, Jaeger, Tempo, Azure Monitor, or any other OTLP-compatible platform.
💡 Tip: Keep the collector in your first experiments, even if it feels like one extra container. It helps you learn the real OpenTelemetry data path early.
Step 3: Turn on auto-instrumentation for Flask
Before running the instrumentation wrapper, install the required packages using uv:
# Install the distro and OTLP exporter
uv add opentelemetry-distro opentelemetry-exporter-otlp

# Bootstrap: install all instrumentation libraries detected in the project
uv run opentelemetry-bootstrap -a requirements | uv add --requirement -
💡 Tip:
opentelemetry-bootstrapscans your installed packages and installs the matching instrumentation libraries automatically (e.g.opentelemetry-instrumentation-flaskfor Flask). See the uv bootstrap guide for details.
Now restart the app with the OpenTelemetry wrapper:
OTEL_SERVICE_NAME=dice-service \
OTEL_EXPORTER_OTLP_PROTOCOL=grpc \
OTEL_EXPORTER_OTLP_ENDPOINT=http://localhost:4317 \
uv run opentelemetry-instrument \
  flask --app app run --host 0.0.0.0 --port 8082
Hit the endpoint again a few times. You should now see:
- traces for incoming HTTP requests,
- metrics about the service runtime,
- logs correlated in the same observability backend.
This is the “aha” moment for most beginners: with only a few environment variables and the instrumentation wrapper, your app becomes observable.
If you want more explicit control, the same sample also shows manual instrumentation:
# Source: https://github.com/mikamboo/opentelemetry-playground/blob/v1.0.0/app.py
from opentelemetry.instrumentation.flask import FlaskInstrumentor

FlaskInstrumentor().instrument_app(app)
Use auto-instrumentation to move fast, then switch to manual instrumentation when you need fine-grained spans or custom attributes.
Step 4: Move from one service to a distributed banking flow
Once the basic Flask app makes sense, the next step is to see the same concepts in a distributed system. The Otel Bank demo adds:
- a browser frontend,
- a Flask API,
- Redis as a queue,
- a background worker,
- the collector,
- the Aspire dashboard.
That topology is what makes distributed tracing interesting:
Bring the whole stack up with Docker Compose:
docker compose up --build
Then open:
http://localhost:8080for the frontend,http://localhost:8082for the API,http://localhost:18888for the Aspire dashboard.
The important concept here is not the UI itself. It is the path of a single user action across several components.
Step 5: Follow telemetry across frontend, API, queue, and worker
In the bank demo, telemetry moves through two different OTLP protocols:
- the browser sends spans over OTLP HTTP through the frontend proxy,
- the API and worker export traces, metrics, and logs over OTLP gRPC to the collector.
The Compose file shows the shared target clearly:
# Source: https://github.com/mikamboo/opentelemetry-playground/blob/main/docker-compose.yaml
app-api:
  environment:
    OTEL_SERVICE_NAME: bank-api
    OTEL_EXPORTER_OTLP_PROTOCOL: grpc
    OTEL_EXPORTER_OTLP_ENDPOINT: http://otel-collector:4317

app-worker:
  command: ["uv", "run", "opentelemetry-instrument", "python", "app-worker.py"]
  environment:
    OTEL_SERVICE_NAME: transfer-worker
    OTEL_EXPORTER_OTLP_PROTOCOL: grpc
    OTEL_EXPORTER_OTLP_ENDPOINT: http://otel-collector:4317
On the browser side, NGINX proxies both the API and telemetry traffic:
# Source: https://github.com/mikamboo/opentelemetry-playground/blob/main/app-frontend/nginx.conf
location /api/ {
    proxy_pass http://app-api:8082;
}

location /otel/ {
    proxy_pass http://otel-collector:4318/;
}
This is where the OpenTelemetry story gets more concrete: the same collector can ingest telemetry from very different runtimes without changing your application architecture.
Step 6: Understand trace propagation through Redis
The most useful part of the bank demo is queue propagation. The API creates a producer span before pushing work to Redis, then injects the span context into the job payload:
# Source: https://github.com/mikamboo/opentelemetry-playground/blob/main/app-api.py
with tracer.start_as_current_span(
    "redis.rpush transfers", kind=SpanKind.PRODUCER
) as queue_span:
    otel_context = {}
    inject(otel_context)
    job = {
        "tx_id": tx_id,
        "amount": amount,
        "otel_context": otel_context,
    }
    r.rpush("transfers", json.dumps(job))
The worker extracts that context and continues the same trace:
# Source: https://github.com/mikamboo/opentelemetry-playground/blob/main/app-worker.py
job_context = extract(job.get("otel_context", {}))
with tracer.start_as_current_span(
    "redis.rpop transfers", context=job_context, kind=SpanKind.CONSUMER
) as dequeue_span:
    process_transfer(
        job,
        parent_context=trace.set_span_in_context(dequeue_span, job_context),
    )
This is the key distributed systems concept to understand:
- one request starts in the frontend,
- the API creates business and queue spans,
- the worker resumes the context,
- the whole transfer stays visible as one trace.
That is much more useful than isolated logs from each service.
What to verify in the dashboard
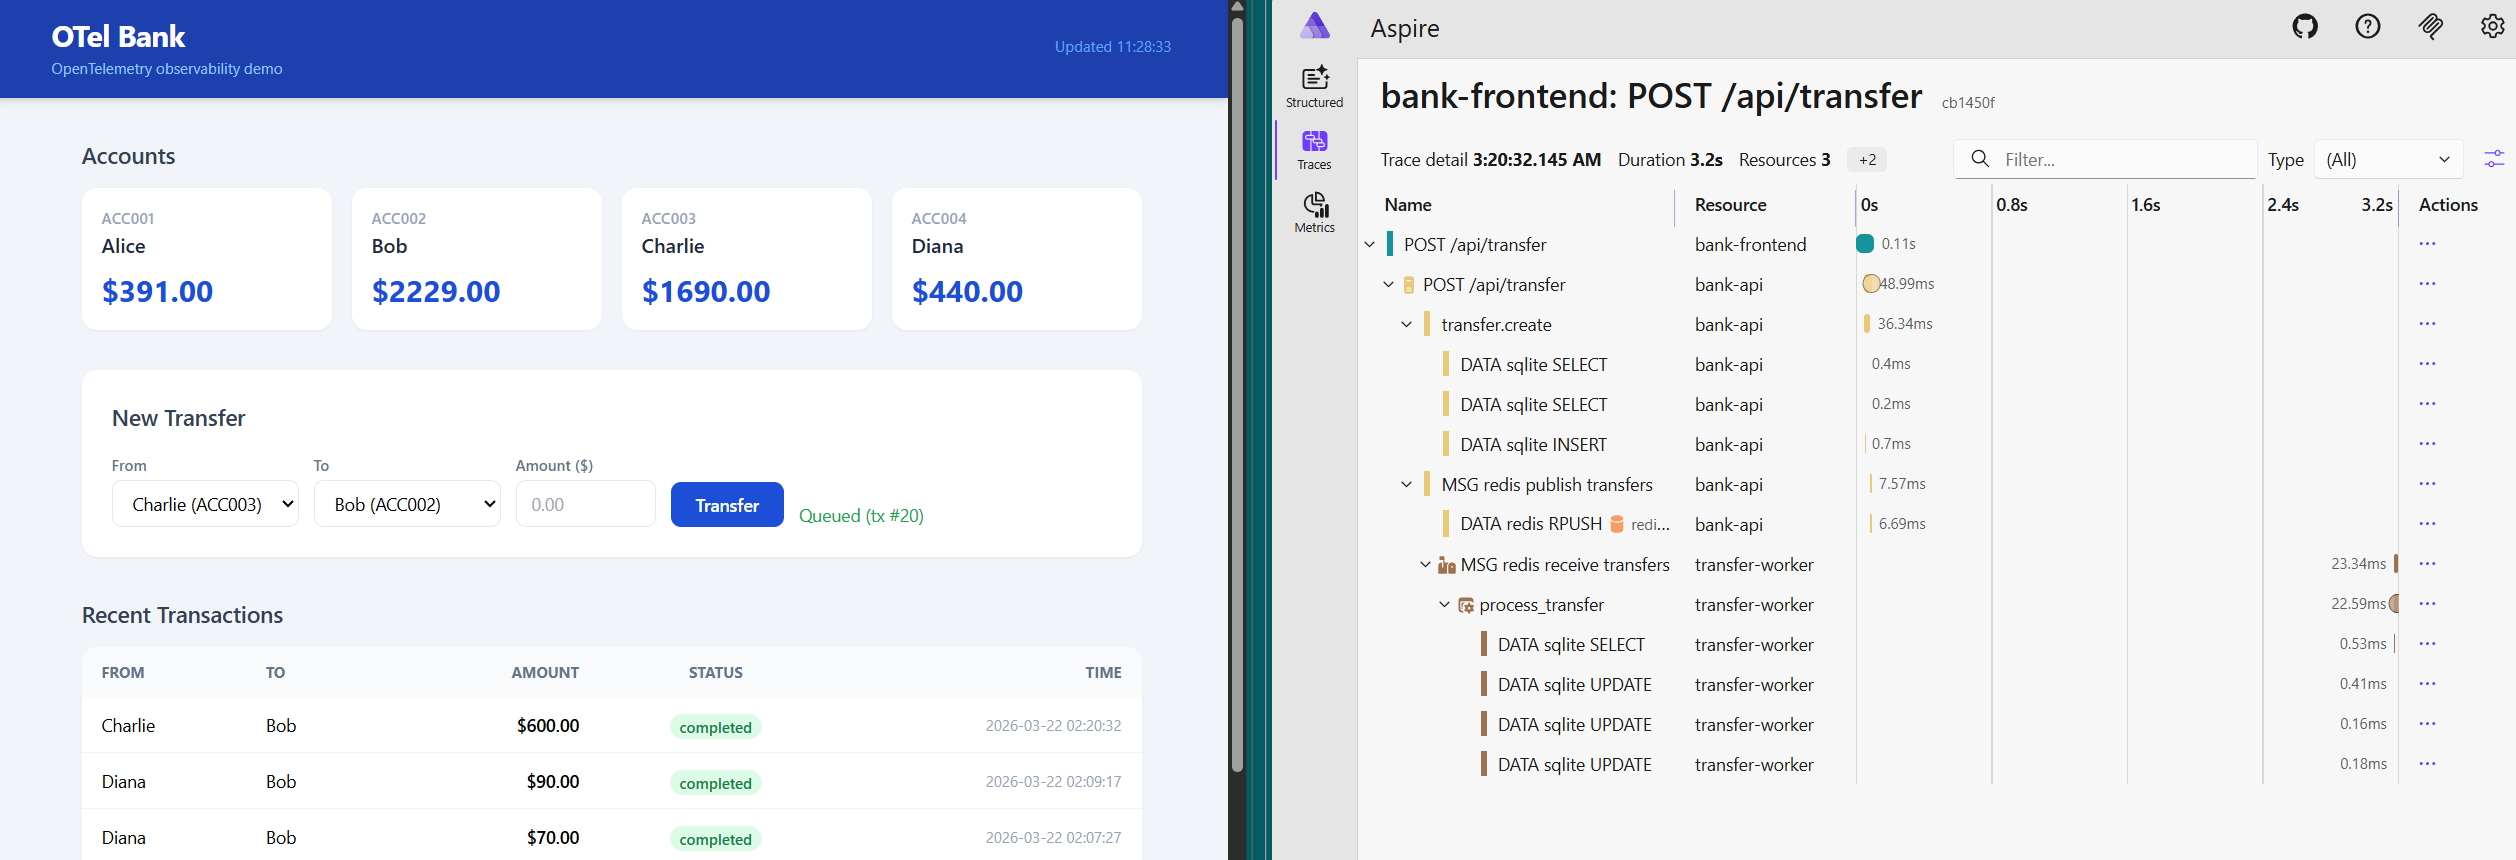
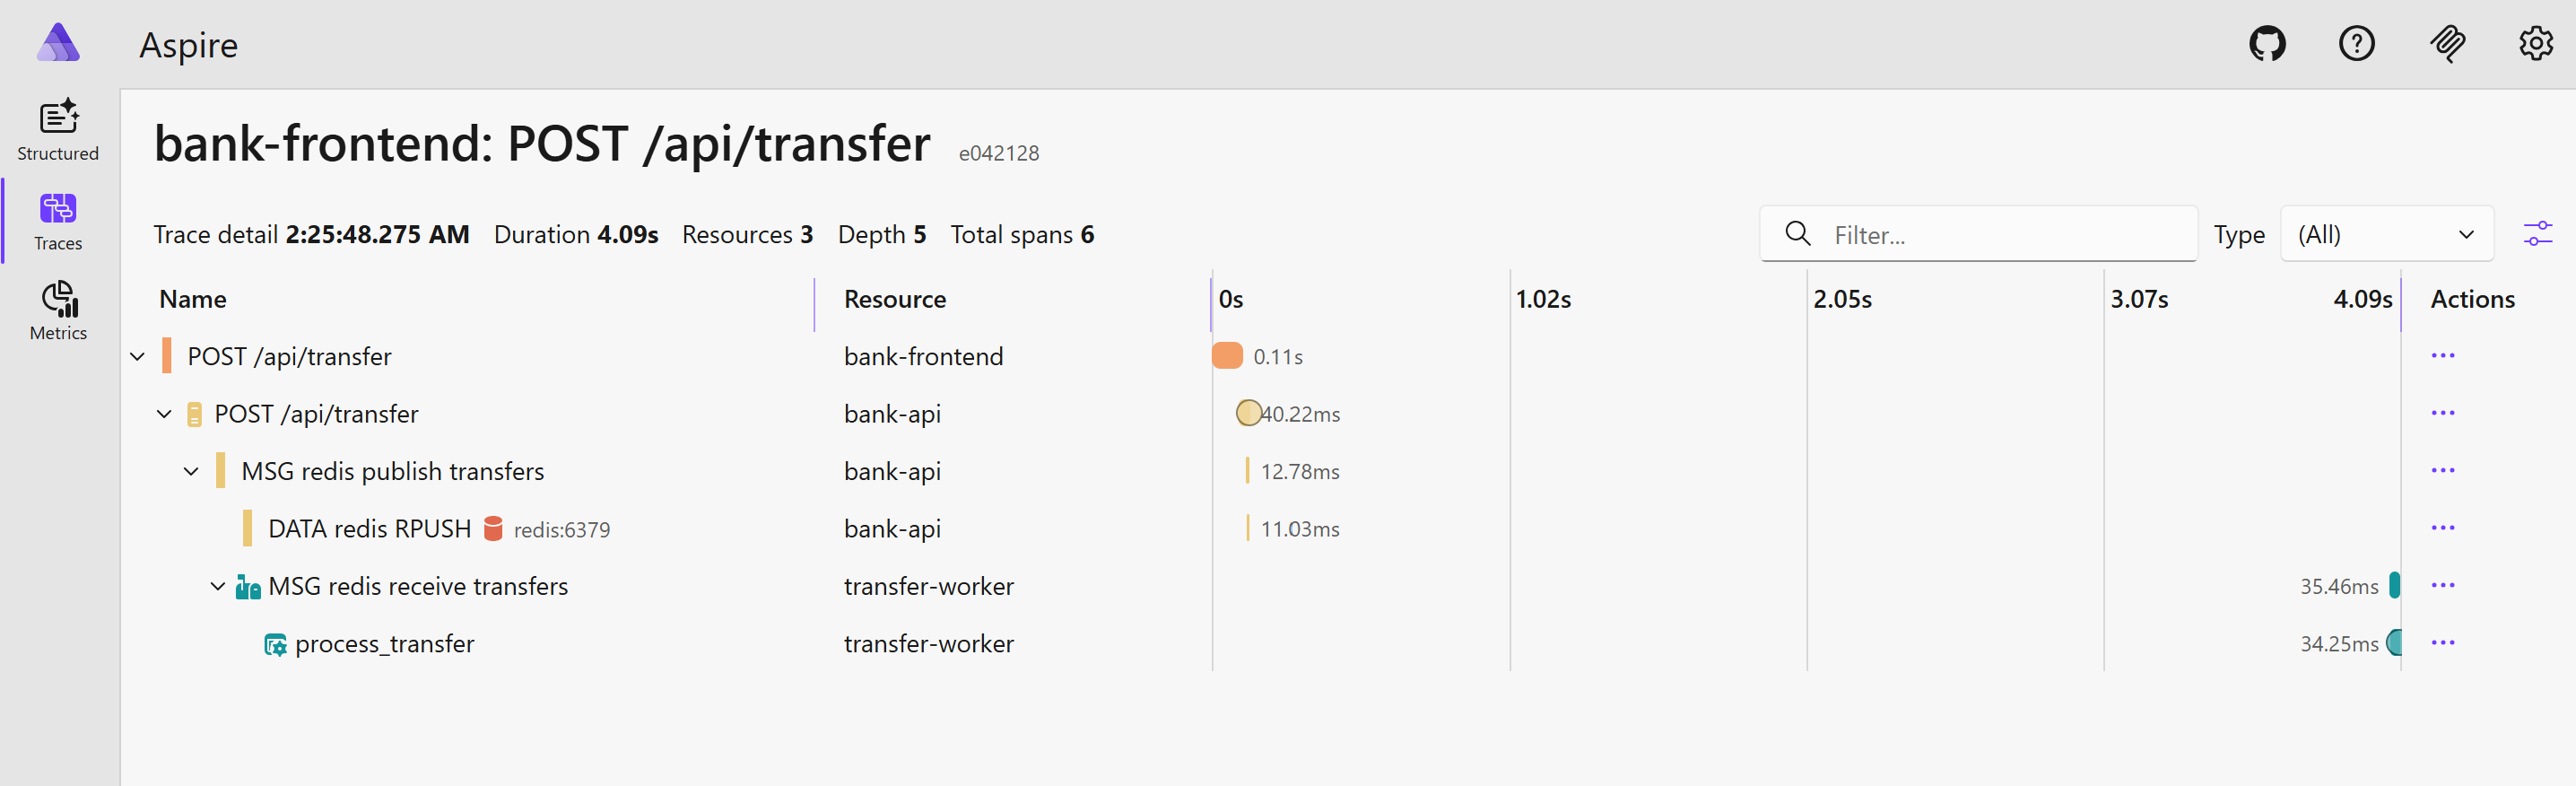
After submitting a transfer in the bank UI, inspect a recent trace and confirm that you can follow the full business flow:
- the frontend request,
- the API transfer creation,
redis.rpush transfers,redis.rpop transfers,process_transfer.
Also verify that custom attributes such as tx.id, tx.from, and tx.to stay attached to the relevant spans. Those attributes are what make traces actionable during debugging.
If you do not see browser spans, check the /otel/ proxy and the collector’s HTTP receiver. If the API and worker are visible but disconnected, the first thing to inspect is context injection/extraction around Redis.
Conclusion
OpenTelemetry becomes much easier when you learn it in two passes: first with a tiny Flask service, then with a distributed app that adds messaging and multiple runtimes. The basic sample teaches the pipeline, and the bank demo teaches propagation.
If you want a practical lab, clone the OpenTelemetry playground, start with the v1.0.0 Flask sample, and then move to the bank observability walkthrough once the first traces make sense. For structured learning, the Linux Foundation course below is also a good companion resource.
References: